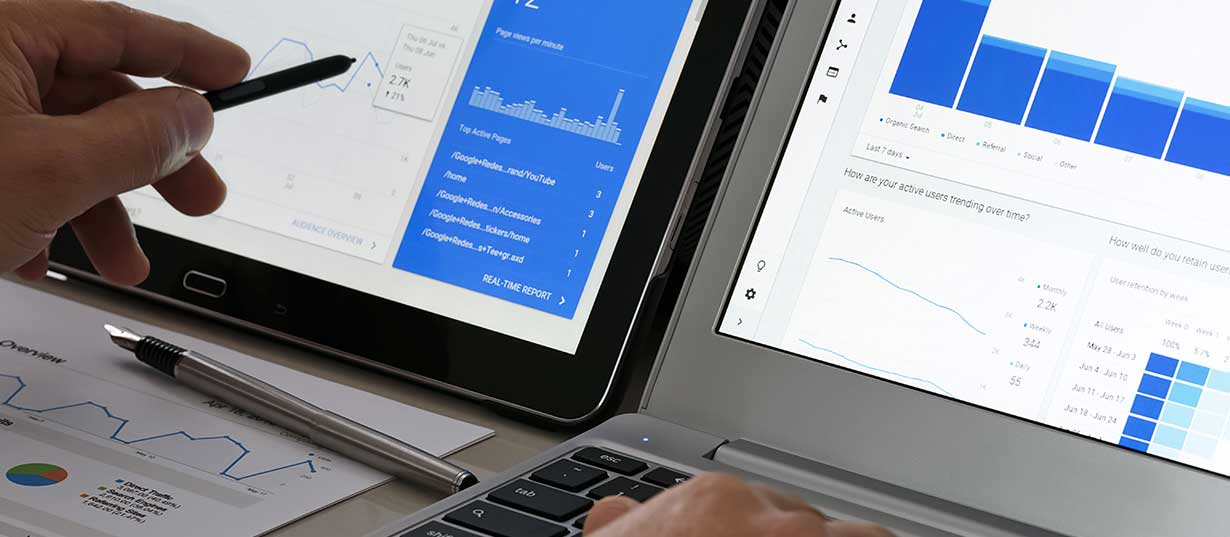
Data Analytics and Visualization

Transform your scattered data into informed decisions with powerful analytics services

2003

Year of Establishment

100s

of Customers Worldwide

4.9/5

Customer Rating

Fingent’s Analytics and Visualization Services

Information management, business intelligence, and analytic solutions to drive positive business outcomes

Data Visualization

A major challenge for businesses today is to present information in a format that supports decision-making. We choose and configure the best technological tools to better comprehend your vast data. Visualization of real-time data helps you implement strategic decisions.


Let’s Discuss Your Project

Data Analytics

Our data analytics solutions empower organizations to mine data for relationships and trends. Through advanced analytics, business leaders can identify patterns in consumer behavior, assess market developments, and predict future results with improved precision.


Let’s Discuss Your Project

Data Warehousing

Our data warehousing solution encompasses the entire data life cycle – from data collection to archiving. Fingent offers scalable and robust data integration practices for the efficient and cost-effective transition of data across multiple departments.


Let’s Discuss Your Project

Business Intelligence

Fingent offers a wide range of business intelligence services to help companies benefit from insights that allow driving cost-saving, improving performance and growing business. Our BI services help you deliver the right information to the right people at the right time.


Let’s Discuss Your Project

Featured Customer Success Stories

Developed a customized data analytics solution for Premium Retail Services that helped them convert large volumes of data into user-friendly visual representations and automate the data input procedures. It also allowed them to manage field data and gauge performance reviews. Read More View All Case Studies

Featured Customer Success Stories

Fingent Deployed a Data Visualization solution for the performance analysis of hospitals in England. The solution comprehends data from NHS to gauge hospital performance including key metrics. It offers viewers with interactive, visual graphs linked across multiple disciplines, and detailed analysis of performance across parameters. Read More View All Case Studies

Featured Customer Success Stories

Fingent developed a solution to help Quantlogic better their trading strategies. Using this solution, Quantlogic performs a predictive analysis of its financial data and does investment planning. The solution handled the analysis of over 200,000 data touchpoints against 12 derived unique verticals, in real-time. It also helped to evolve predictive patterns and represent relations. Read More View All Case Studies

Featured Customer Success Stories

We deployed a data management solution that simplified the management of large volumes of data, including events and participation patterns. The solution enabled visualization of event locations, participation, list performers, and enabled real-time management of events, including attendees, performers, and economies of events. Fingent also automated data operations, which simplified event management tasks. Read More View All Case Studies

Why innovate your business with Fingent

Consistent high-quality results with robust agile teams and dedicated QA practices

Highly cost-effective and best-of-breed solutions with no last minute surprises

Transparent project management with maximum adherence to deadlines

Our Unique Approach & Process

By initiating your project with Fingent, you get a dedicated and skilled team backing you up round-the-clock. All our processes are customer-oriented, designed to reduce the cost of business operations, address IT resourcing challenges, and offer you a competitive edge. We start with a deep analysis of your requirements and continue our relationship with post-launch support and updates.

1

Research and Discovery

2

Validating and Shaping Idea

3

Design and Prototyping

4

Development

5

Testing and Quality Assurance

6

Maintenance and Support

Contact Us

Hundreds of leading businesses have derived strategic advantages from our transformative solutions.


    Upload project file not exceeding 2 MB. Allowed file type: PDF

    The entire engagement was completely transparent and very systematic. It’s been an exceptional working experience.

    Their team is completely committed to our success as a client, and they do that with their dynamic team.

    They’ve also been great at meeting the needs of our timeframe versus theirs.

    They go above and beyond what the typical developer interaction would be.

    They were highly responsive to our needs.

    We found their project management solid.

    Reviews from engineers testify that their code was consistently solid and comprehensively documented.

    I have been very pleased with Fingent Corporation’s user experience and design capabilities.

    Fingent’s project team demonstrated passion and commitment throughout the dev cycle and it was very evident in their work.

    They’re an honest company to deal with … they were always fair and reasonable.

    FAQs

    Data visualization is the method of representing data in a visual context by making obvious the trends and patterns ingrained in the data. Such patterns and trends may not be explicit in text-based data. The traditional forms of visualization, in the form of charts, tables, line graphs, column charts, maps, and many other forms, have been replaced lately by highly insightful 3D visualizations.

    Data analytics is used to identify or discover the trends and patterns inherent in the data. In simple terms, data analytics is the method of examining structured or unstructured datasets in order to derive useful insights to draw conclusions about the datasets.

    Data visualization is the act of deriving information from vast text data and representing it in a visual context such as a graph, chart, map, table, and so on. Data visualization simplifies big data for human comprehension and also makes it easy to detect patterns and trends in groups of data.

    Data visualization influences decision-making and transforms organizational processes. Since the human brain tends to process visual information faster, it is easy to summarize complex data using simple graphs or charts. Effective data visualization can replace the cluttered reports or spreadsheets, making way for clear communication. This allows business leaders to interpret and act upon the valued insights rapidly.

    Data analytics is basically used for making sense of Big Data. Data analytics employs the tools and techniques to gather, transform, filter, classify, and convert data into easily understandable formats. Today, every business is striving to become a data-driven organization by collecting more data related to markets, customers, and business processes, and then classifying, storing, and analyzing the data to derive valuable insights from it.

    Gathering data from different departments of a business enables the company to gain real-time insights into various processes such as finance, sales, marketing, product development, and so on. Using these insights, teams within a company can collaborate better, attain better results, and excel in the competition. Data analytics allows employees to view and perceive data in a particular context. This enables them to make smarter business decisions that lead to improved products and services.

    Both data analytics and data visualization are two powerful business intelligence (BI) tools that an organization can use to mine its vast collection of data. Data is not useful if you don’t have the supporting technologies to mine, process, organize, and analyze the data. The real value of business data lies in the insights that can be derived from it.

    Data analytics and data visualization cannot serve as isolated components. In today’s competitive marketplace, both should work hand in hand to leverage the true potential of your data.

    ×