Intuitive Dashboards: Essential Solutions to Boost Efficiency
Warning: in_array() expects parameter 2 to be array, null given in /home/www/fingenttest/public/wp-content/themes/fingent/template-parts/content.php on line 37
Warning: in_array() expects parameter 2 to be array, null given in /home/www/fingenttest/public/wp-content/themes/fingent/template-parts/content.php on line 81
One thing that is inevitable in every business enterprise, irrespective of size or industry, is decision making. It is also the one thing that is common to all managers irrespective of the level of management. As a manager, the performance of your team or company depends on the decisions you take for it. Therefore, the better your decisions are, the better will be your company’s performance.
In order to support you in your decision-making process, it is important to use the best possible tools so that you can make better, more informed decisions. One such tool, that makes use of analytics and makes internal decision making in an organization a lot easier is interactive reports or dashboards.
Of late, dashboards have become one of the most popular business intelligence tools, because of several reasons, the major one being that it is a lot cheaper. Apart from that there are several benefits. Here we describe an instance where we created dashboards for a US based client called Premium Retail, who specializes in providing retail solutions and helped them increase efficiency.
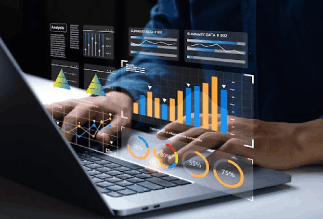
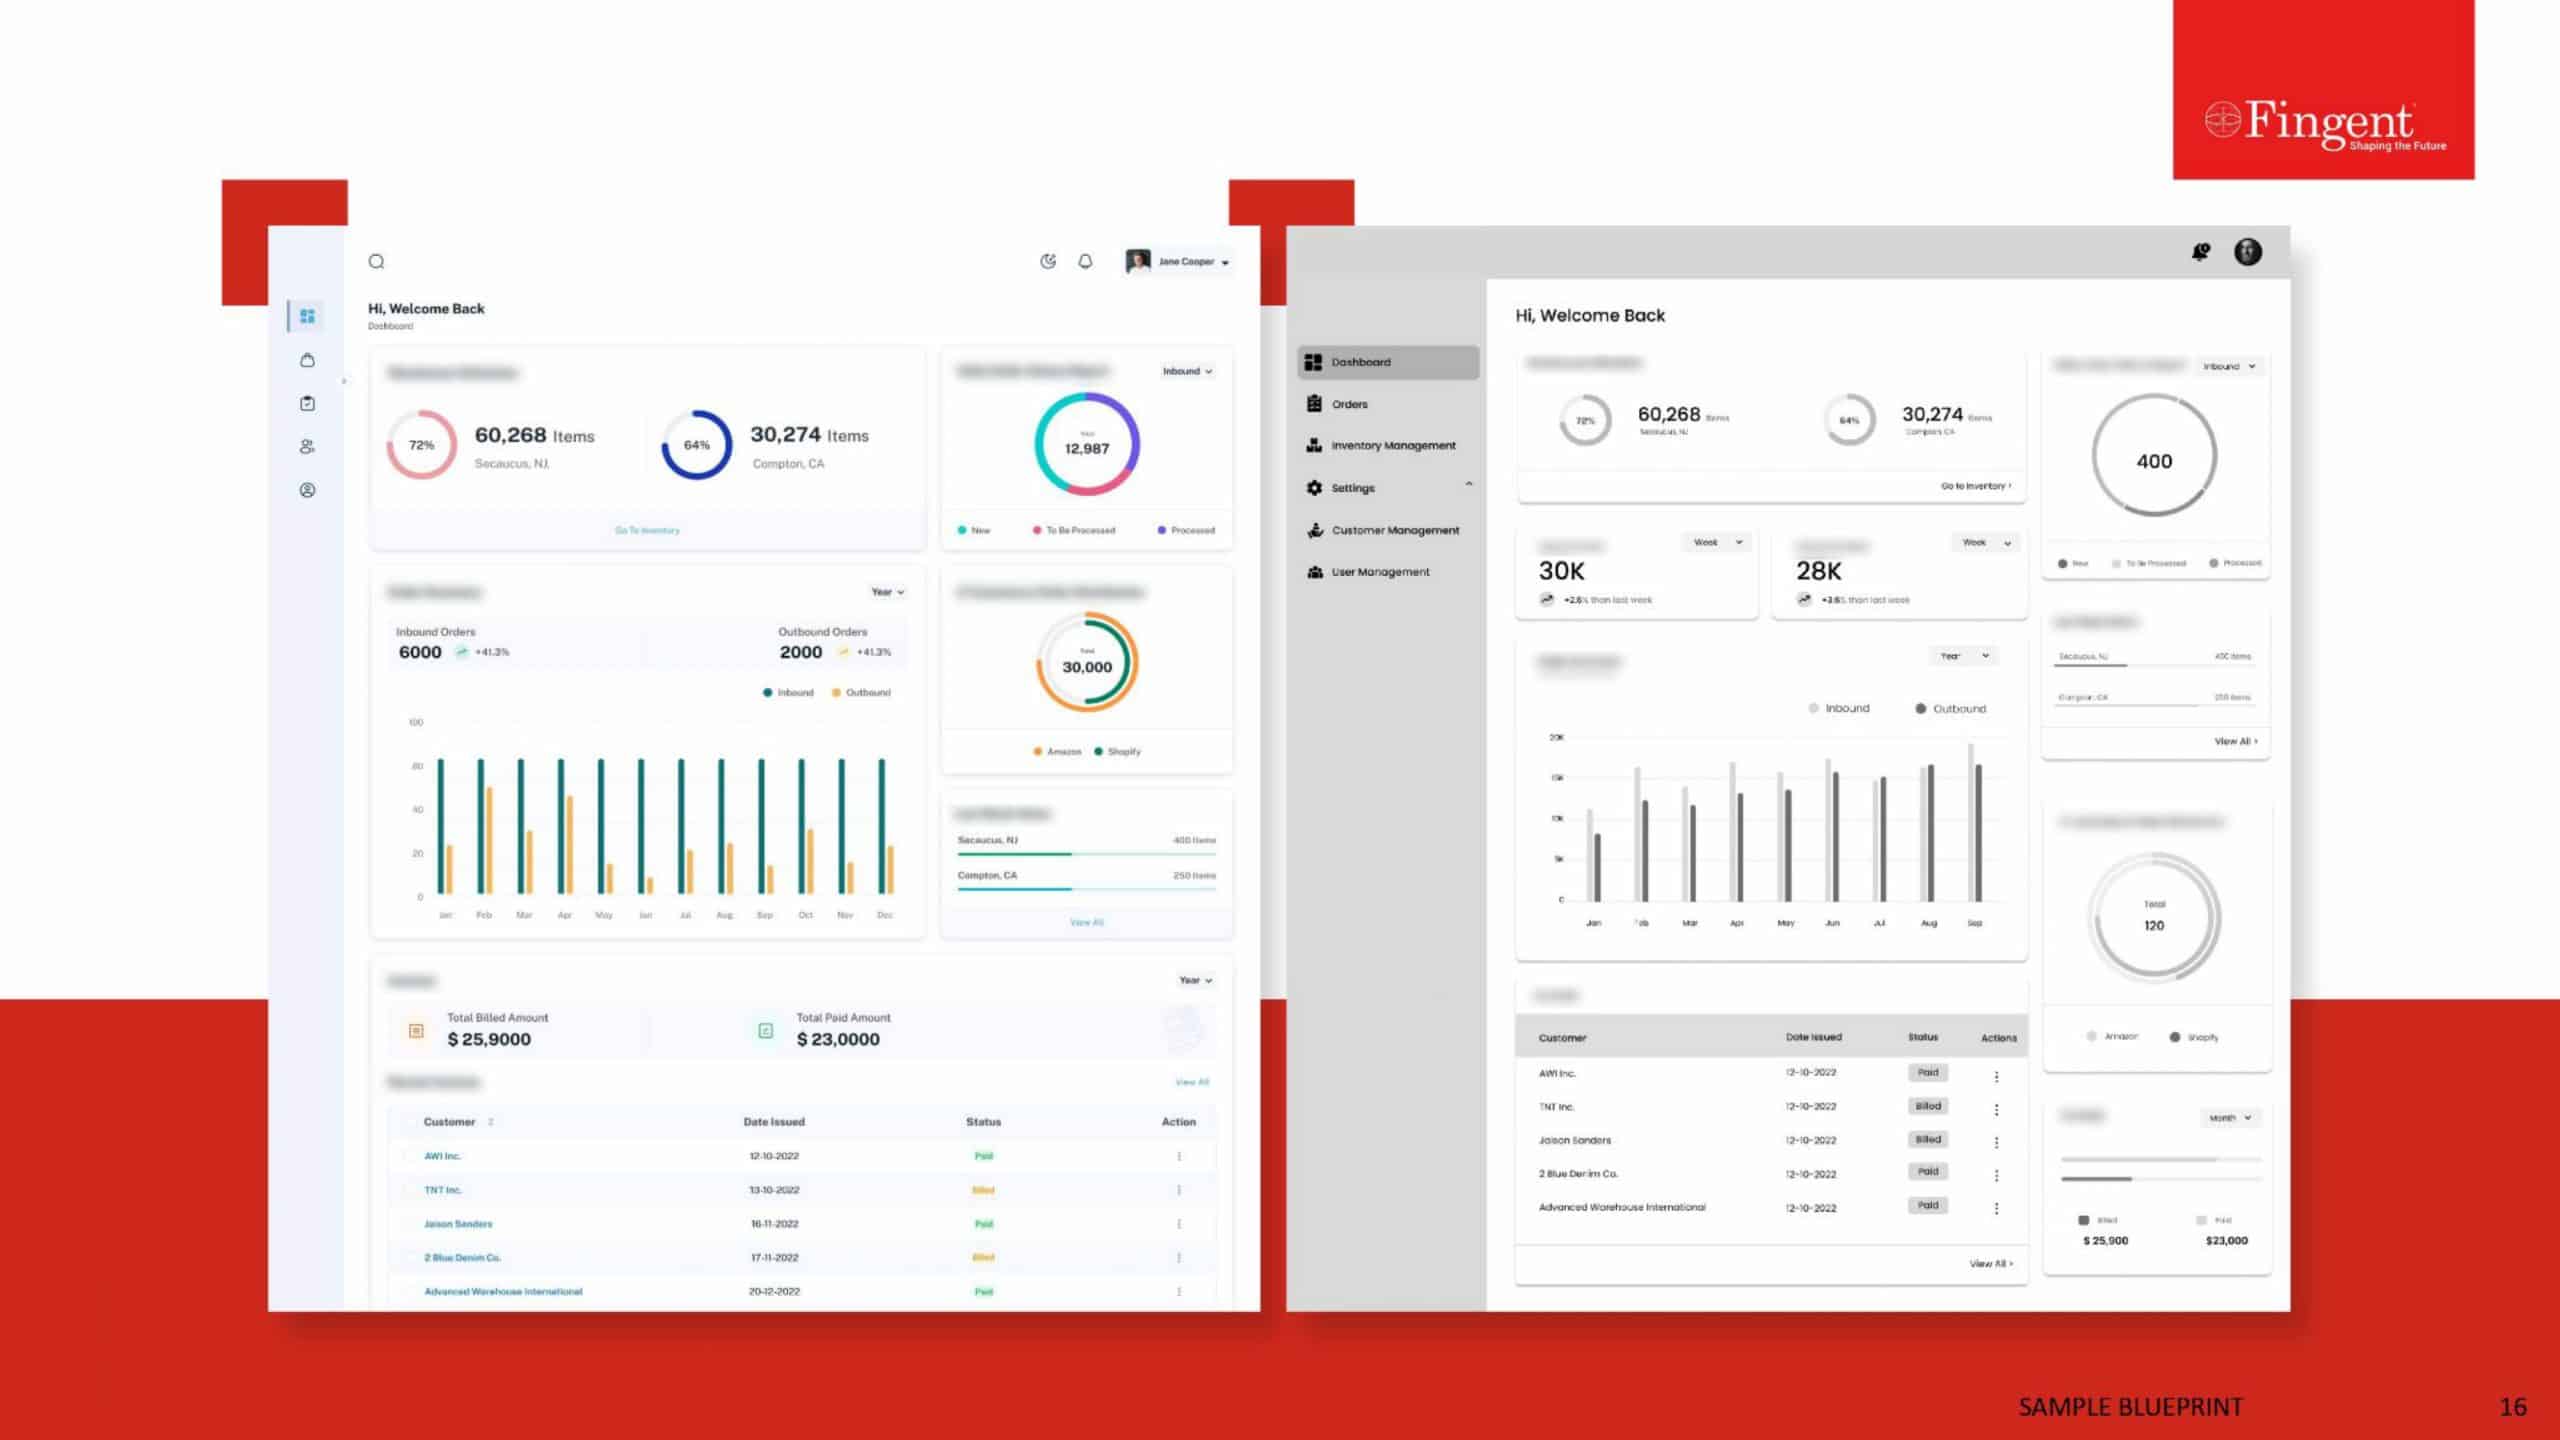
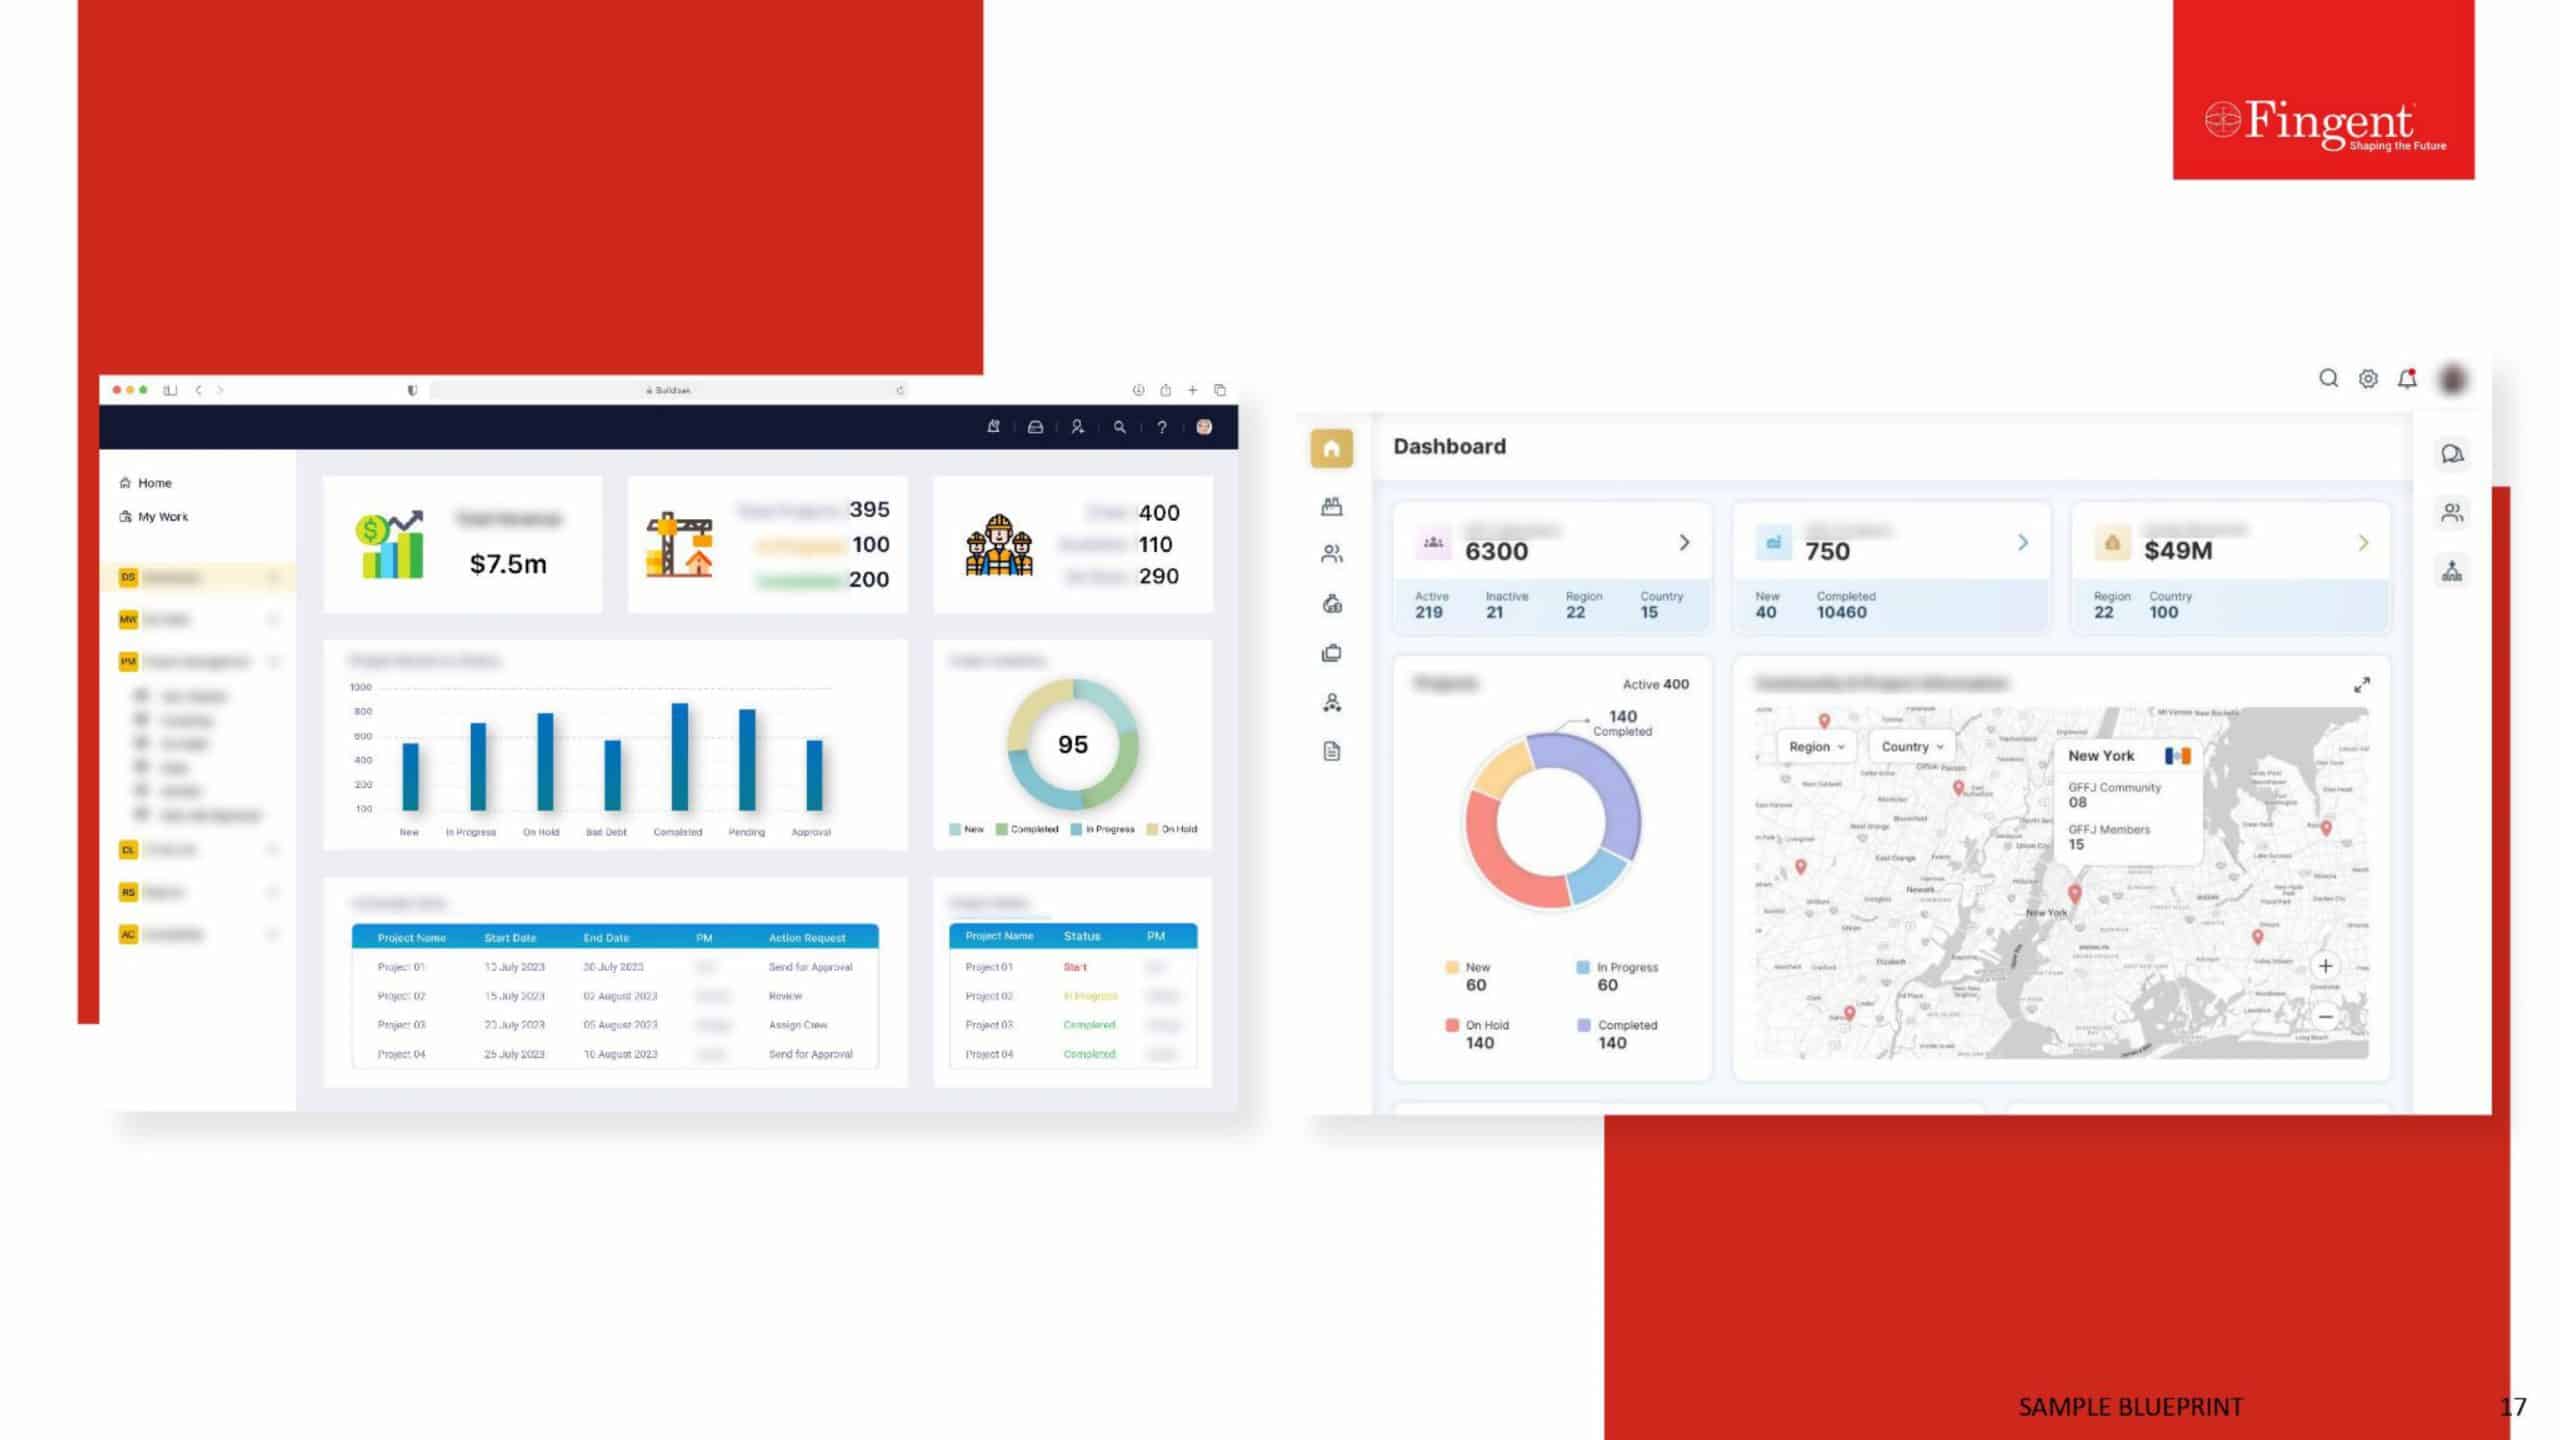
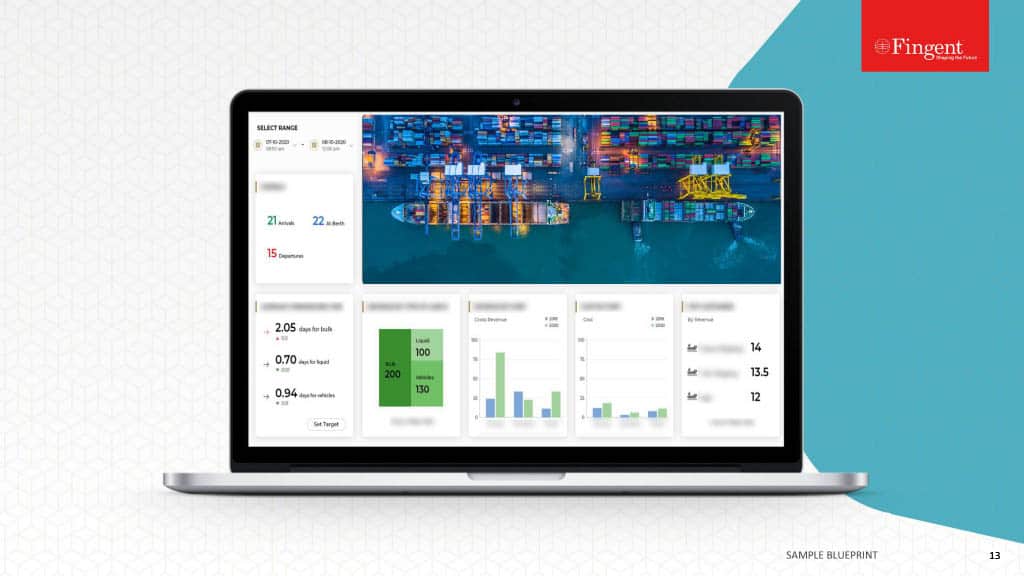
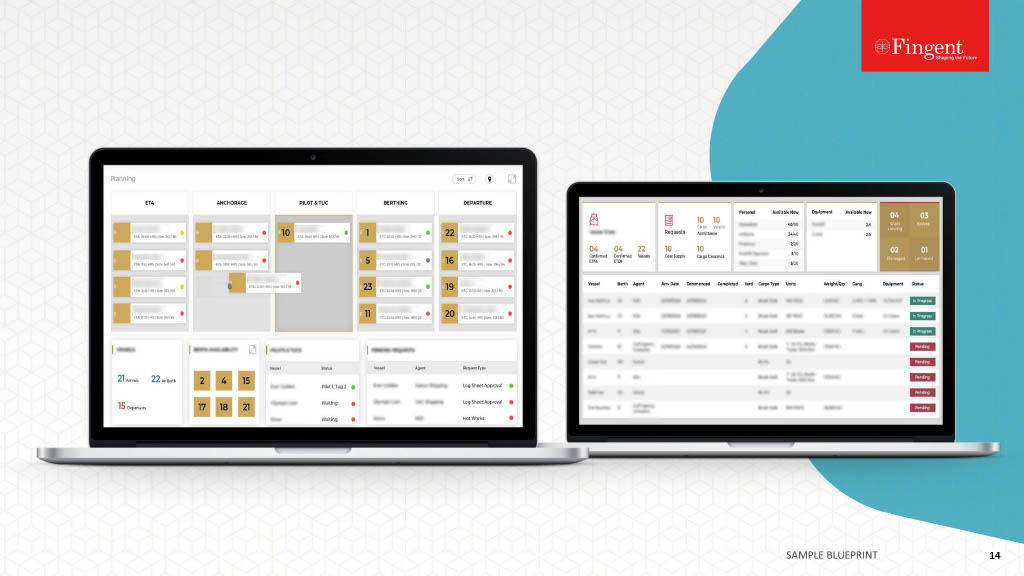
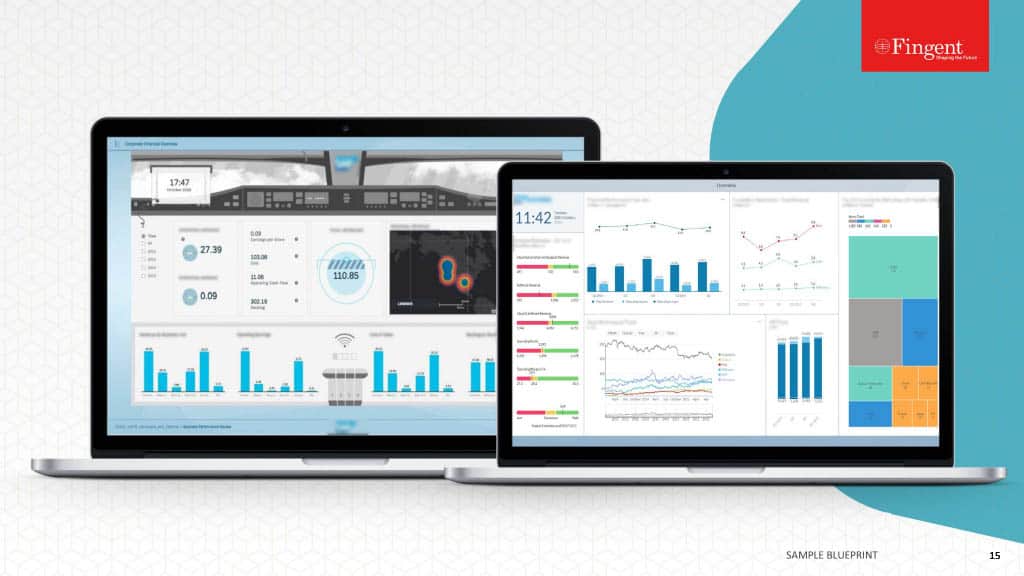
The dashboards (web applications) that we built for Premium Retail were highly interactive and insightful. We made two sets of dashboards in order to capture the Key Performance Indicators (KPIs) of their field agents and to show the coverage (channel coverage) percentage of the different divisions of the organizations. These dashboards converted the large amounts of data, handled by managers, into user-friendly visualizations which made analysis and interpretation much easier. They also had interactive charts with different kinds of filters which further helped in gaining critical insights in a matter of a few clicks. In all, the intuitiveness of these dashboards gave way to the following benefits to the organization.
- Better understanding of business operations – As all of the business flow/ logic was captured in a single application, it became easier for the managers to monitor and check for discrepancies or anomalies and take corrective decisions. For example, the dashboards showing the coverage percentage enabled the managers to get a snapshot of overall channel coverage nationally or state wise or even market or zip code wise very quickly and easily. Hence, the managers got a better understanding of the state of affairs which in turn helped them take better decisions.
- Better understanding of low-performance areas and employees – The dashboard was also used for tracking the performances of the field agents based on which the ones that require extra training and development could be narrowed down. It helped the managers take corrective actions in this regard and do the necessary in bringing up the efficiency and productivity of the employees ultimately improving the profit margin.
- Better time management – The managers of Premium Retail received huge amounts of data on a monthly basis and hence analyzing and interpreting them took a large amount of time earlier. But with these dashboards, the time they were able to save on analysis was massive. It helped them reduce the man hours required for interpreting the huge data points. They were able to garner useful and relevant insights very easily making the entire management of the data, a much easier and time-saving task.
- Budget control – These dashboards required only the initial costs of deployment. Hence, they were able to keep the costs that were involved in the analysis of data, well under check. For example, the cost of human resources required for analysis of the data could be reduced by a huge margin, as the installed dashboards could do the task.
All these benefits helped them bring up the productivity of their employees as well improve the efficiency of the organization as a whole.
With such performance tracking dashboards, you will be able to judge the efficiency of their employees whereby you are in a position to take better decisions regarding his employees. This improves your credibility and efficiency from the point of view of the top level management which increases your chances for promotions and appraisals as well. Dashboards not only help in increasing the efficiency of managers and department heads but also of the employees which in turn improve the overall efficiency of the organization as well.
Do you need help in managing large volumes of data and in developing useful insights out of the data? Talk to us! We can help you develop and enforce a custom software for your data and analysis.
Stay up to date on what's new

Recommended Posts

28 Apr 2023 B2B
Utilizing SAP Analytics Tools to Turn Your Data Into Valuable Insights!
SAP is widely known for its brilliant abilities and functionalities, the foremost being Data Analysis. The newest version of SAP ERP is the SAP Data and Analytics Solution. It has……
18 Feb 2022 B2B
Top 10 Data and Analytics Trends Ruling the Roost in 2024
Over 95% of businesses struggle to manage unstructured data in their day-to-day operations. Inability to decipher data prevents them from navigating the market successfully, making business forecasts, and customizing their……

12 Sep 2020 Sports
Why Sports Analytics is a Crucial Ingredient in Today’s Match Winning Formula
Analytics in Sports: Redefining the Tactics of Winning Games with Statistical Data Sports used to be simple. Play the game and compete to win. Entertainment value aside, athletes and teams……

22 Jul 2020 Education
Prepare for the Future of Digital Innovation with these 10 Services From Fingent
10 Services Offered by Fingent to Prepare Your Business for the Future of Digital Innovation Introduction Robotic Process Automation Business Continuity Planning Contactless Services Custom LMS | eLearning Business Process……
Featured Blogs
Stay up to date on
what's new


 US
US Insurance