Why Data Analytics?
Importance of data analytics and visualization in business
- Data analytics allows companies to assimilate vast amounts of information regarding their business operations quickly
- Business leaders can identify the relationships between multi-dimensional datasets to make well-informed and transformative decisions
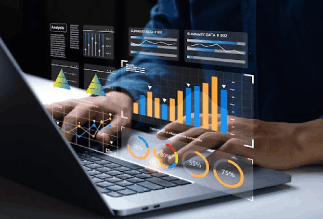
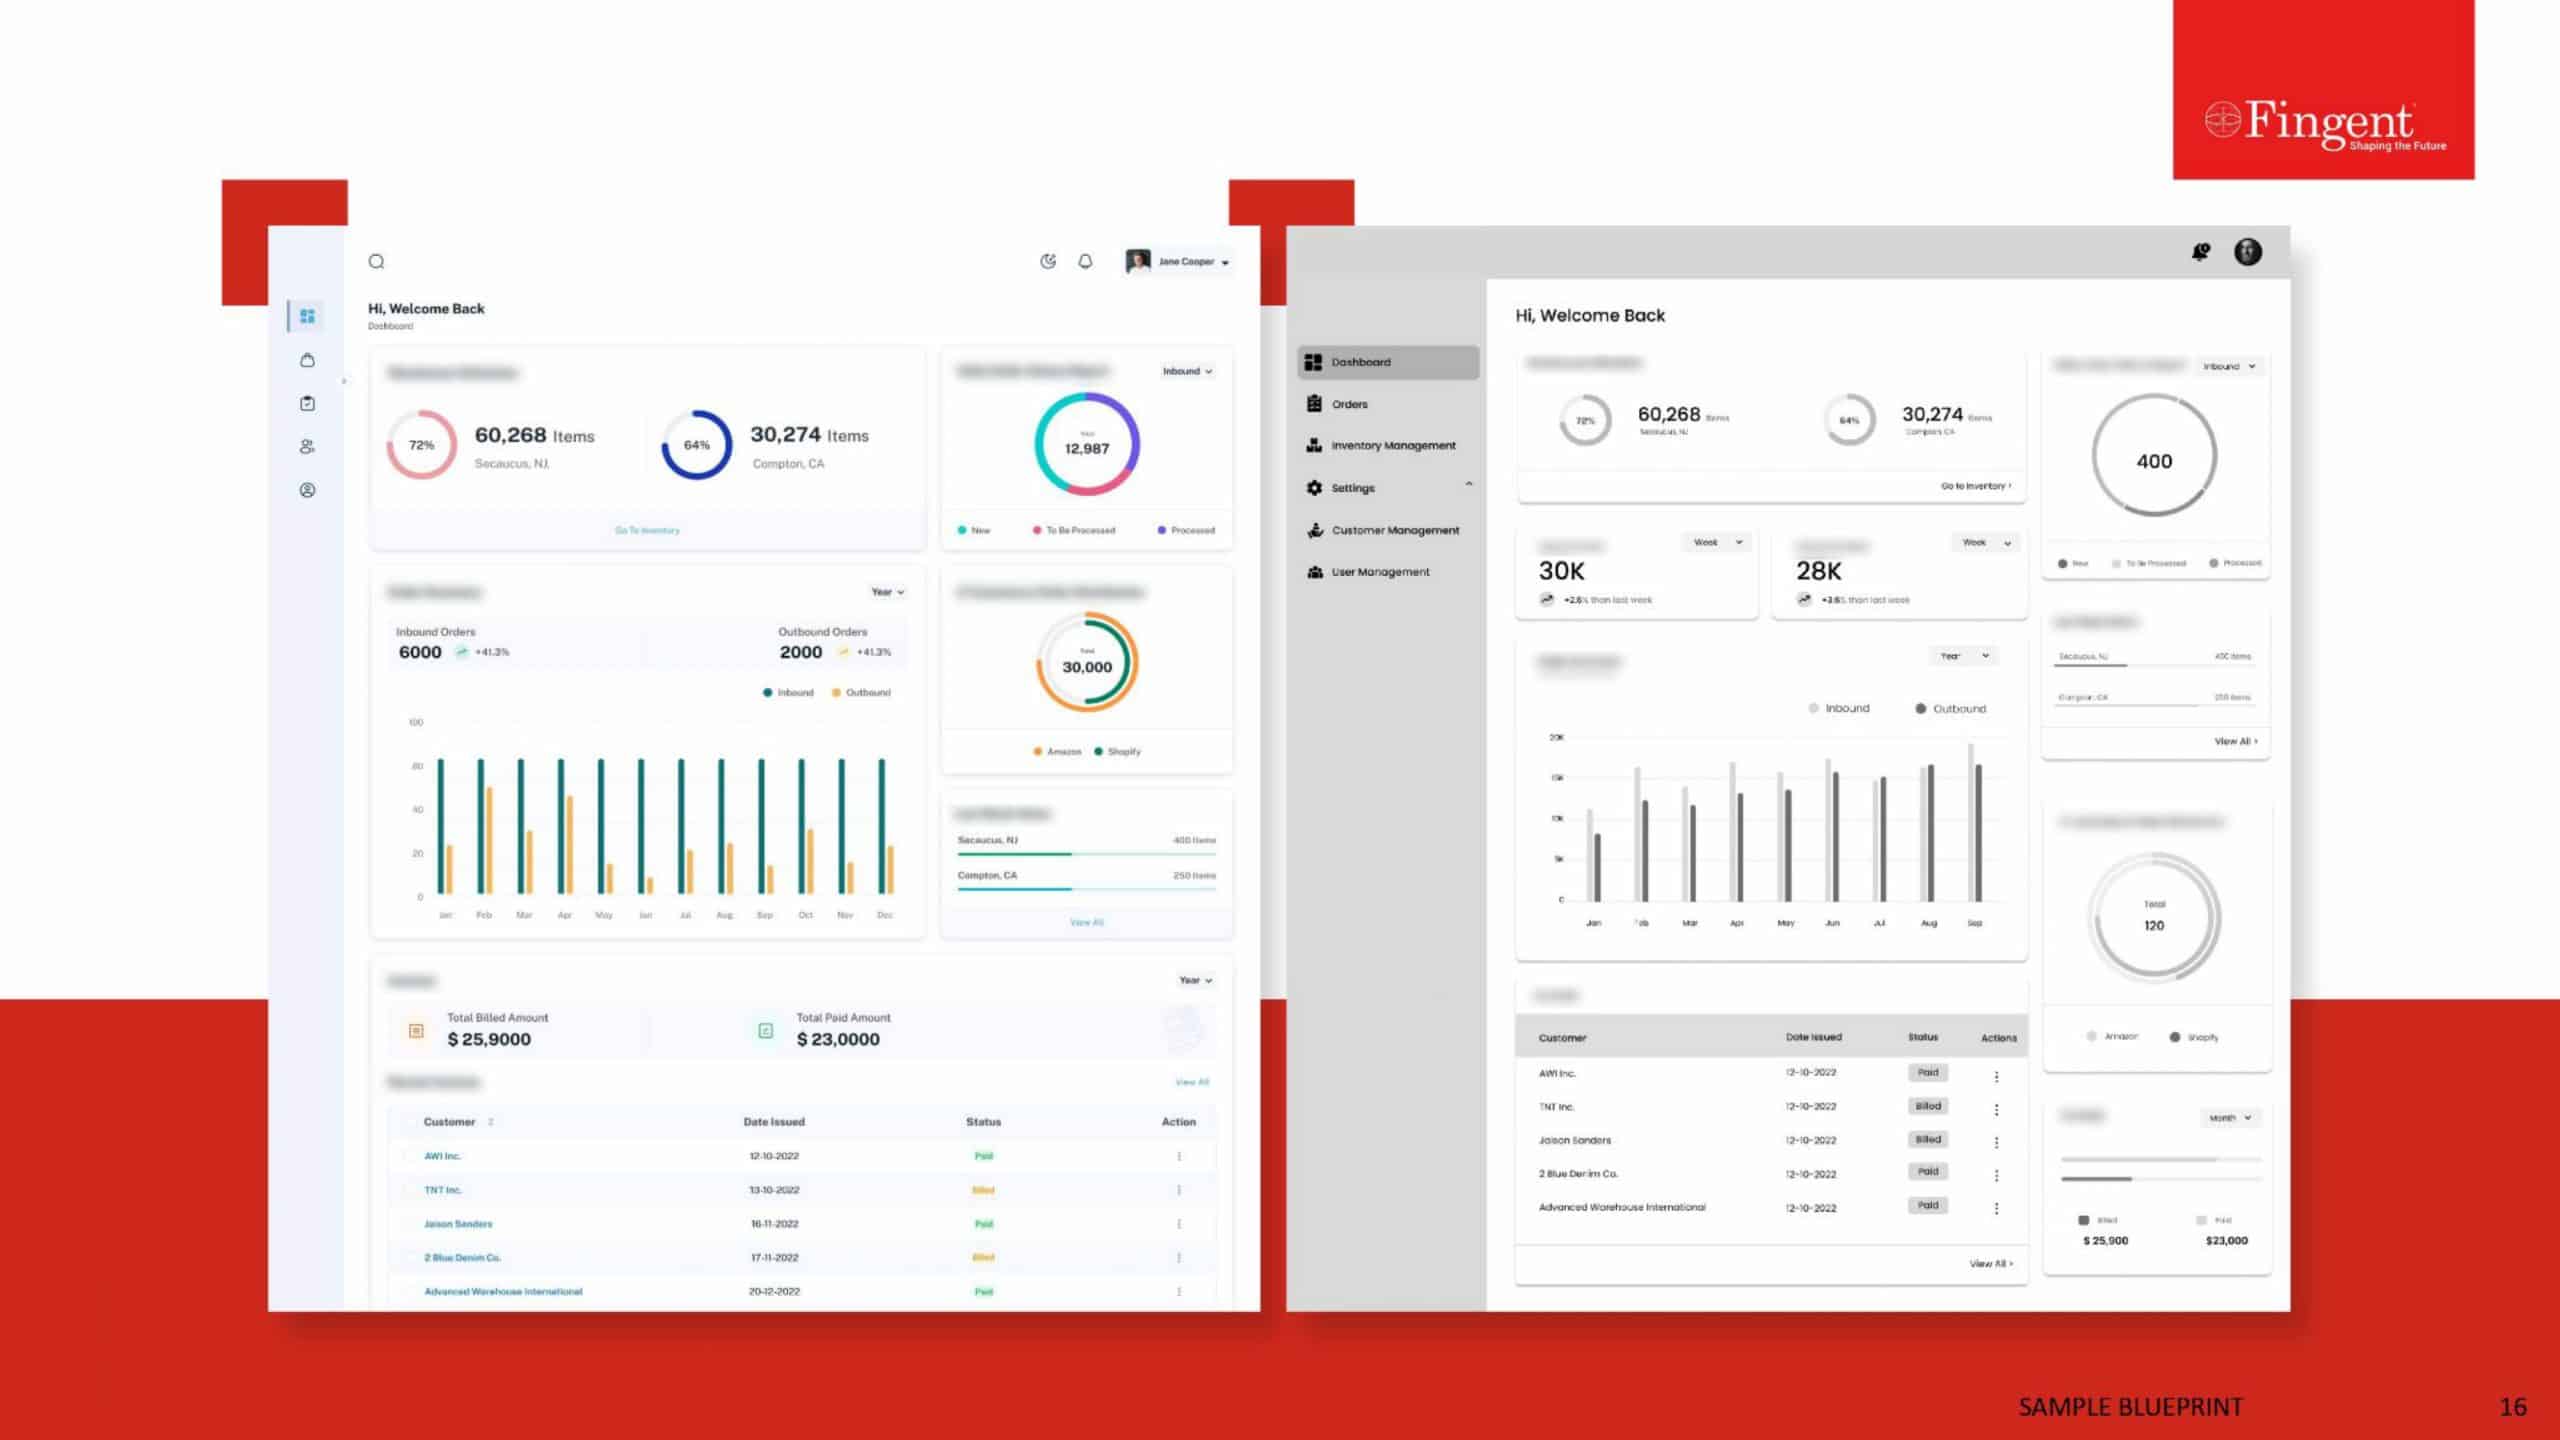
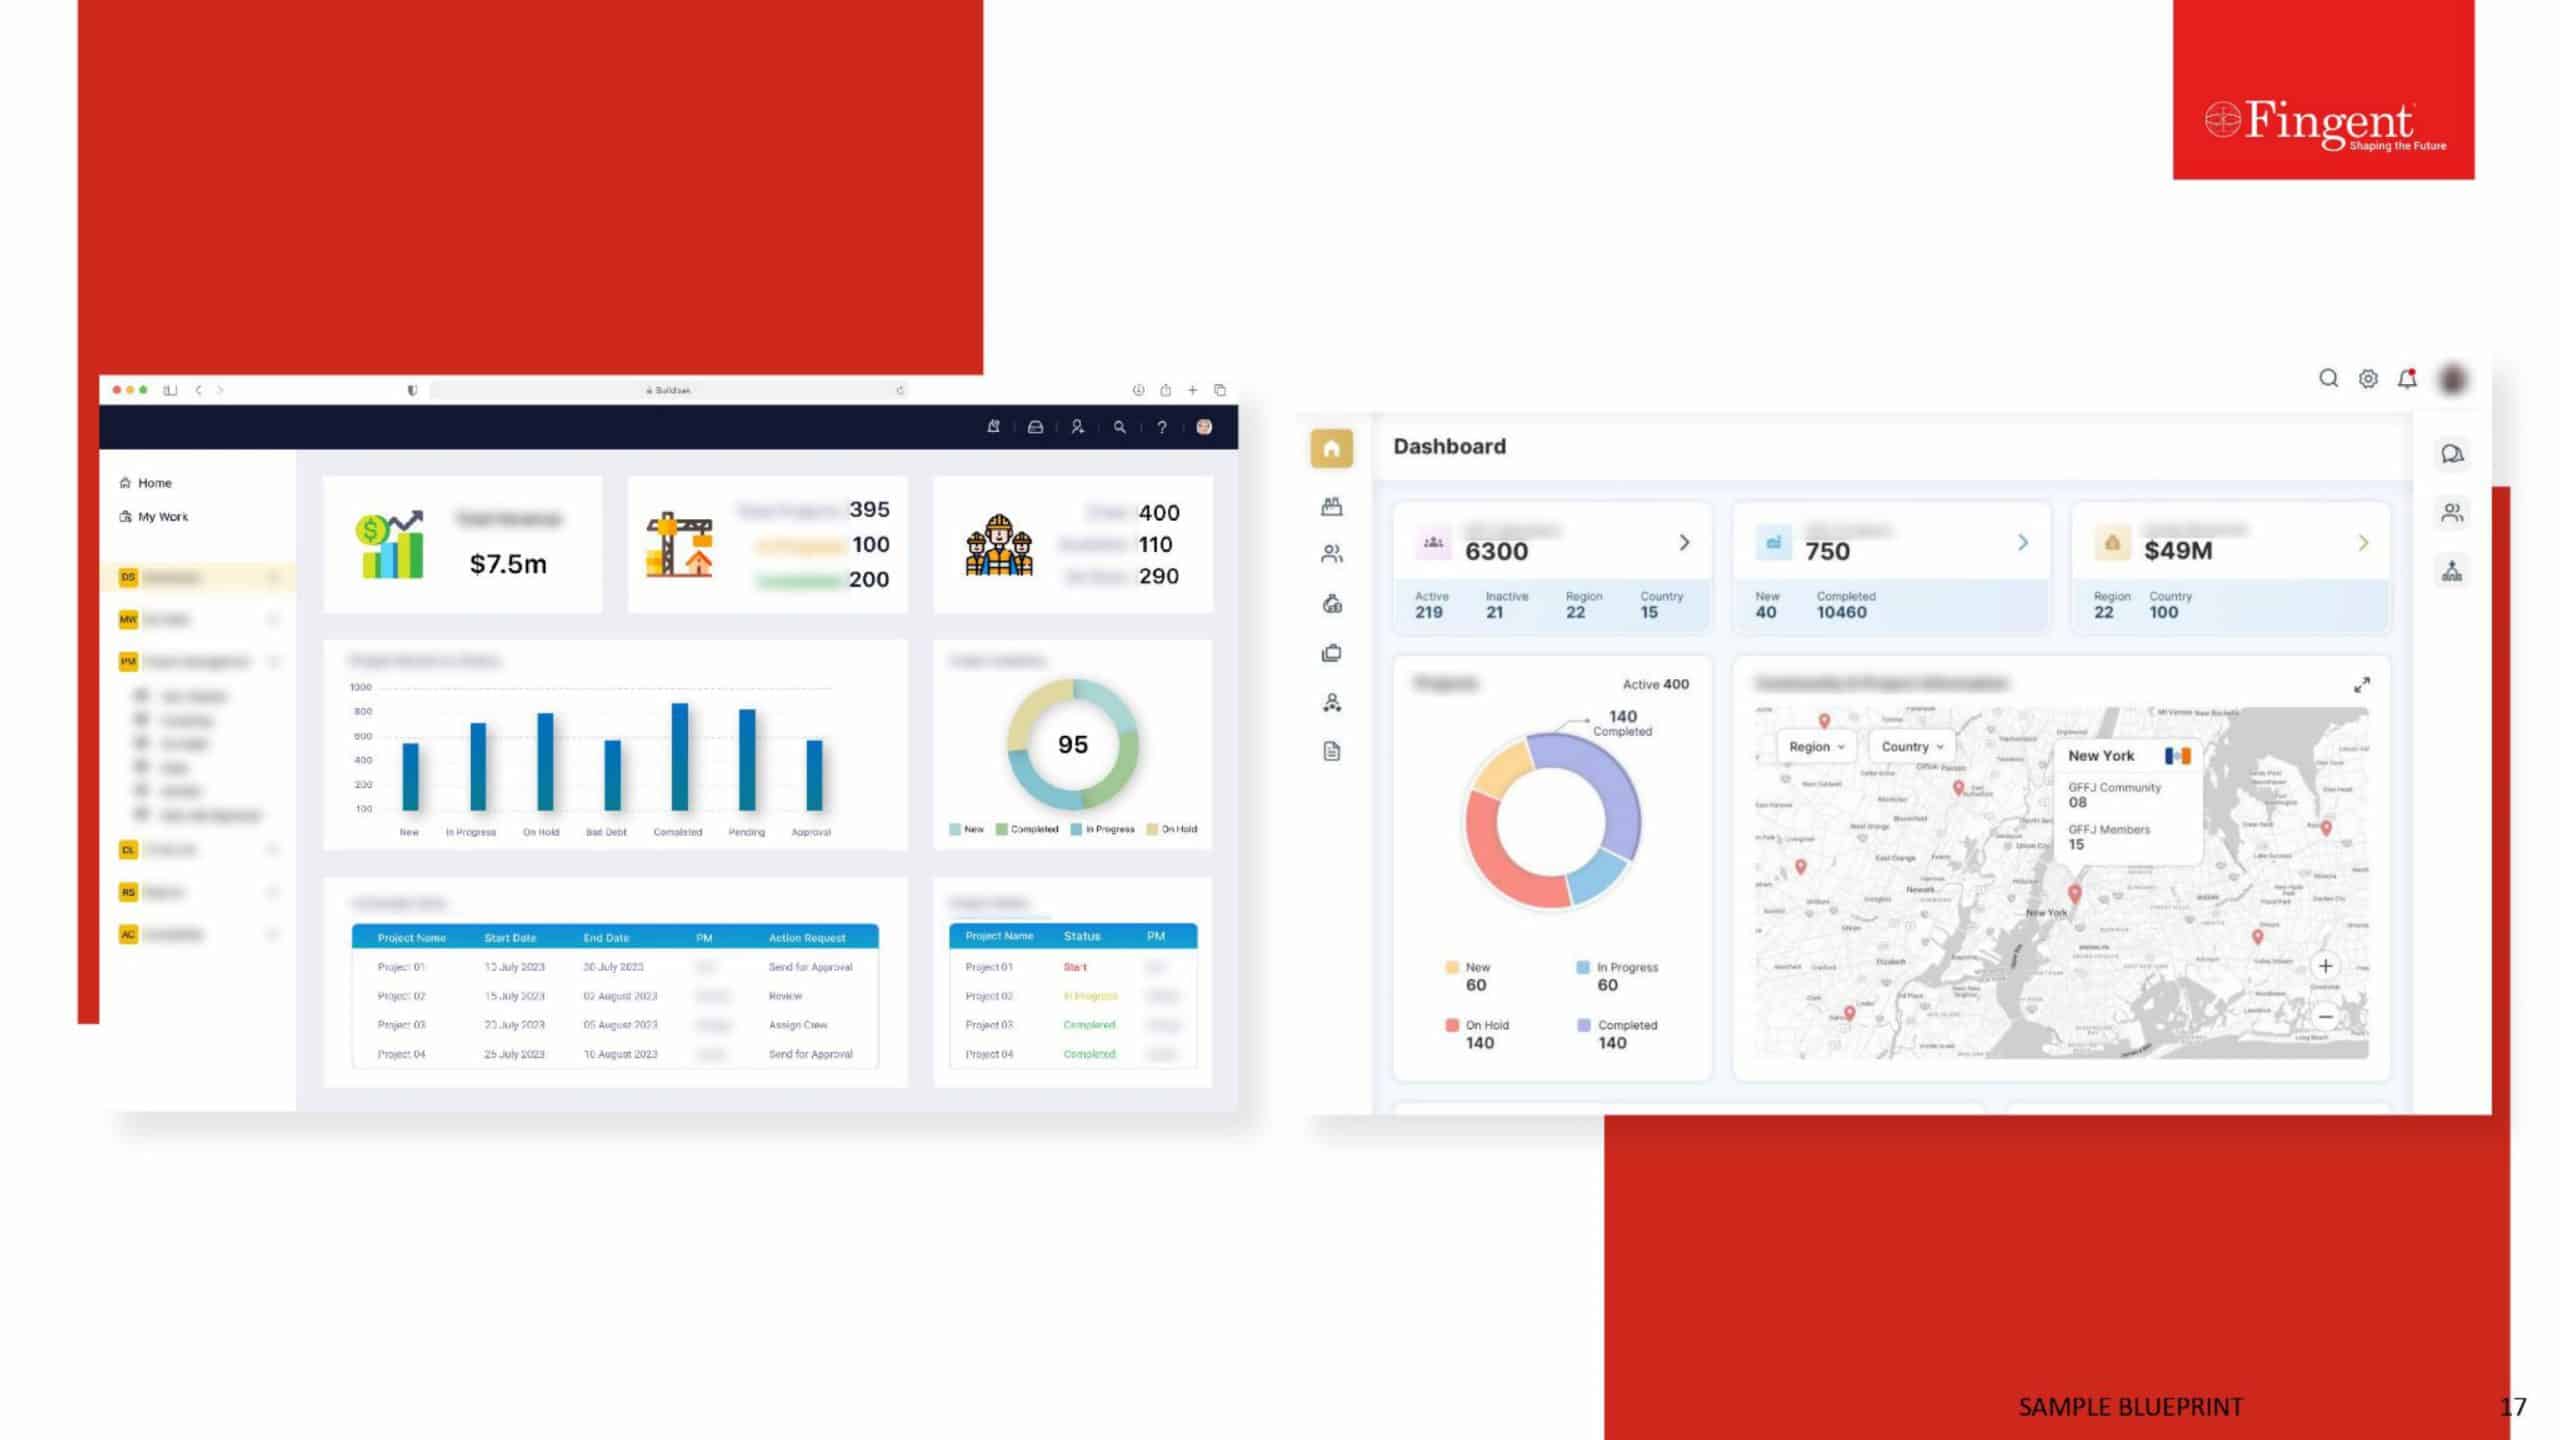
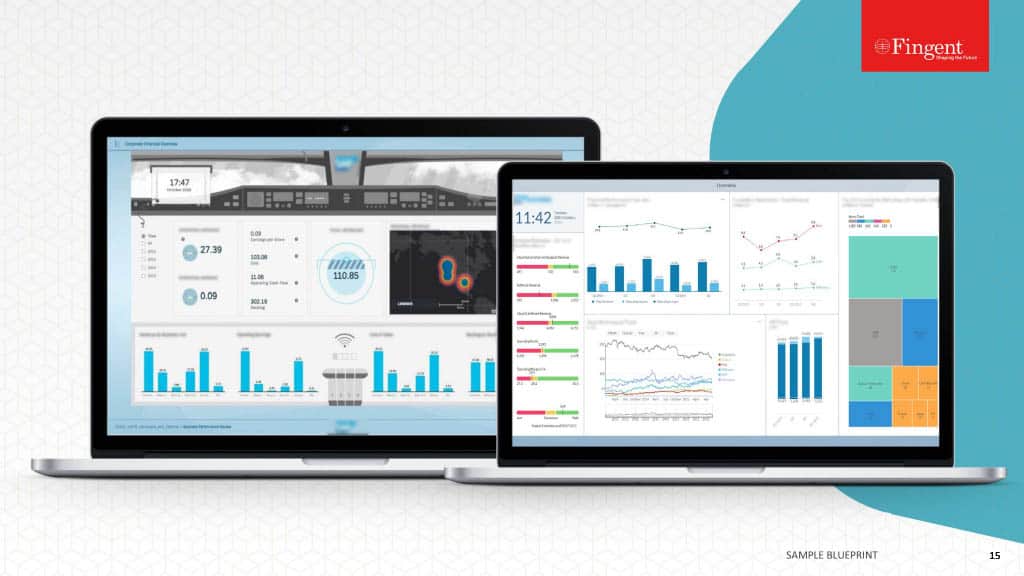
- Data visualization techniques allow business leaders to interpret data effectively using fever charts, heat maps, and other graphical representations
- Customer analytics enables companies to dive deeper into customer sentiment data and unlock opportunities to launch new services
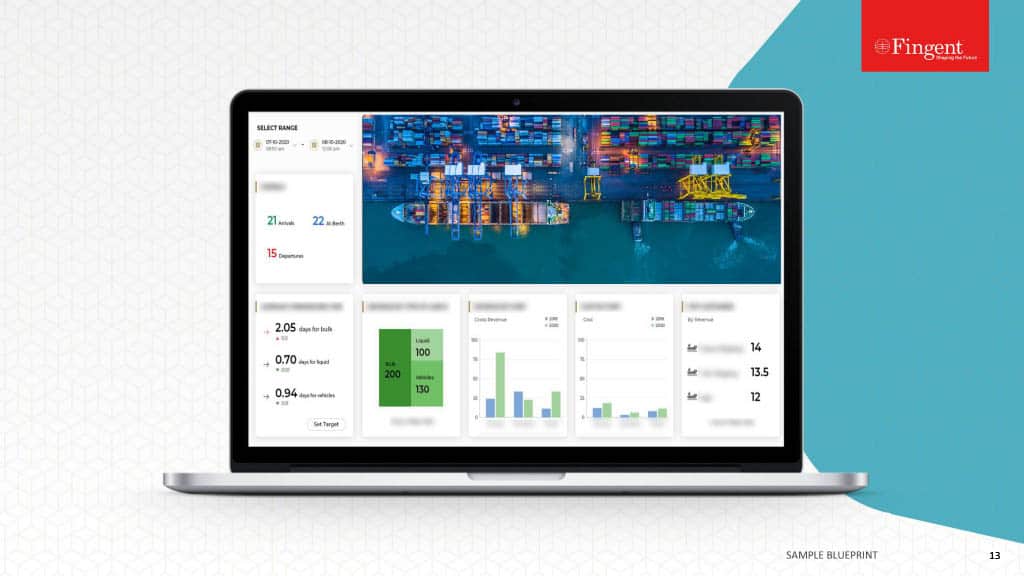
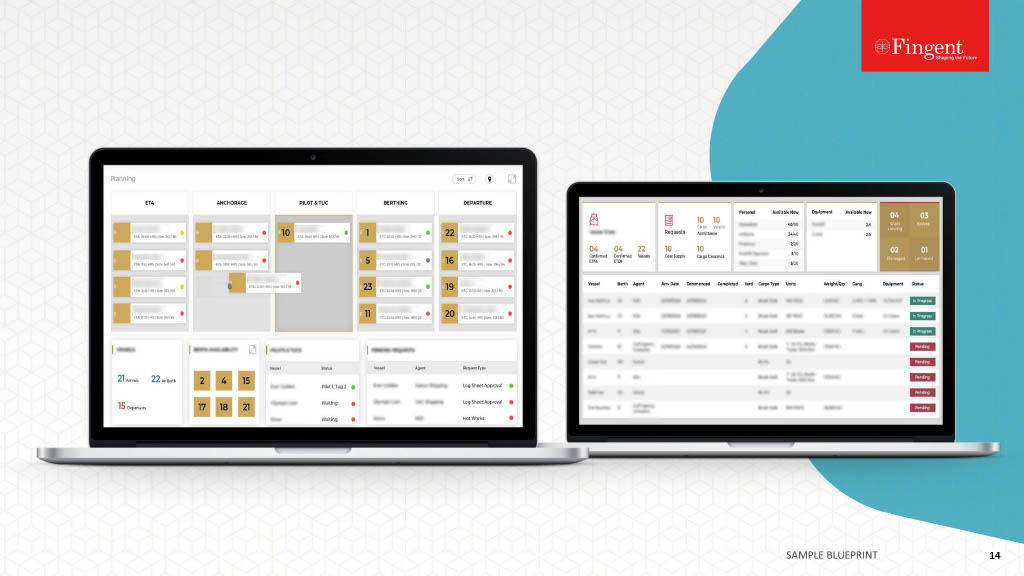
- Customized analytics dashboards provide actionable insights into business operations that could help in boosting productivity and sales
- In-depth visualization of latest marketing trends, customer behavior, demand variations, sales, and pricing derived from strategic data sources
- Insights based on true data eliminate the need for wild speculations and guesswork
How do they differ?
Difference between data analytics and data visualization
Data Analytics
is the process of analyzing data sets to make decisions based on business information, with the help of specialized software and systems. Analytics enables businesses to better understand their customers, improve advertising campaigns, personalize content, and improve bottom lines.
Data Visualization provides an accessible way to see and understand trends and patterns in data by representing the information in graphical or pictorial formats. General types of data visualizations are charts, tables, graphs, maps, and dashboards.
Business Analytics Applications
Applications of data analytics in business
Marketing :
Forecast customer behavior and demand variations to devise new product strategies and act on trends to increase customer satisfaction, improve customer experience, and create loyalty.
Retail :
Streamline management operations, optimize processes to reduce costs, opt for profitable pricing models, and discover customer preferences to personalize offerings.
Healthcare :
Access medical records and treatment history to infer insights, accelerate treatment development, streamline administration of drugs, and improve care delivery.
Fraud and risk detection :
Banks, insurance companies, cybersecurity firms, governments, etc. use data analytics to detect fraudulent activities, identify new risks from data patterns, pinpoint anomalies, and identify potential root causes of fraudulence.
Supply chain management :
Predictive analytics can help with inventory and warehouse management, B2B supplier networks, route optimization for delivery agents, and notification of potential delays to deliveries.
Analytics & Visualization Tools
Tools and technologies used to support data analytics and visualization
Data analytics tools and technologies
- Predictive analytics software and hardware for storing and processing big data sets
- Machine learning and statistical algorithms for making predictions about future event outcomes
- Stream analytics tools to filter, aggregate, and analyze big data
- Distributed storage data usually replicated on a non-relational database
- Non-relational data management systems (NoSQL databases) that work well with large sets of distributed data
- Data warehouses, data lakes, knowledge discovery and big data mining tools
- Software solutions for data virtualization, integration, quality, and pre-processing
Data visualization techniques
| Infographics | Line Charts | Treemaps | Bullet Graphs |
| Area Charts | Scatter Plots | Bubble Clouds | Fever Charts |
| Population Pyramids | Heat Maps | Time Series Charts |
| Infographics | Line Charts | Treemaps |
| Bullet Graphs | Area Charts | Scatter Plots |
| Bubble Clouds | Fever Charts | Population Pyramids |
| Heat Maps | Time Series Charts |
Picking The Right Tools
Choosing the right data analytics and visualization tool(s)
What to look for when selecting a data analytics tool?
- Agility and scalability to support both existing and future business requirements
- Access to data and reporting features that help in meeting business objectives
- Costs associated with the analytics solution, including subscriptions, growth, and hidden fees
- User-friendly interface and visualization that even non-technical users find easy to use (to reduce IT dependency)
- Integration of the analytics platform with existing business applications and third-party tools
- Mobile analytical capability and cloud support to make decisions on the go
- Customization and collaboration support and built-in security provided by the platform
- Ability to combine multiple sources of data, and analyze structured, semi-structured, and unstructured data
What to look for when selecting a data visualization tool?
- Best data visualization tools incorporate leading visualization best practices that allow important data patterns to stand out from the crowd
- Easy to use drag and drop elements that allow users without a technical background to create charts and graphs quickly
- Ability to connect and blend data from multiple internal and external sources
- Portability across devices to support growing business mobility
- Robust built-in enterprise security, including single sign-on authentication methods, role-based data access, and network security
- Training and support resources, specifically for building complex visualizations
- Powerful collaboration features to share visualizations, annotate, receive feedback, and build stories using data
Have An Idea Or Requirement To Discuss?
Pros & Cons of Analytics
Benefits and challenges of big data analytics
Benefits
- Analyzes large amounts of data from different sources
- Facilitates strategic and informed decision-making
- Cost savings resulting from business process optimization
- Better understanding of customer needs, behavior, and sentiment
- Marketing insights for customizing product development
- Improved risk management strategies
Challenges
- Growing amounts of data pose accessibility challenges
- Complicated data storage and processing methods
- Time, resources, and effort to manage data quality
- Data security challenges
- Picking the best analytics tool that aligns with users' needs and infrastructure
- Skills shortage in the field of analytics
Infrastructure Requirements
Infrastructure considerations to implement data analytics
- Scalability of the infrastructure to serve the growing network, storage, processing, and computing needs of your business
- Right technology stack and big data management tools that can handle the volume and type of data you have
- Security infrastructure comprising data access control, policy enforcement, access roles and permissions, confidentiality, trust, availability, and privacy
- Policies for deactivating applications to keep your system clean
- General purpose data storage and processing infrastructure that is typically cloud based and provisioned on-demand
- Failover mechanisms, backup, and restoration capabilities to deal with processor, storage, software, and facility failures
- Collaborative environment to support user groups creation and management
Investments & Returns
Factors that affect data analytics costs and ROI
Investments
- Nature, type, quality, and amount of data
- Business specific data analytics requirements and the tools that best meet them
- Development and customization efforts
- Data analytics software pricing
- Organizational agility, ability to quickly adapt to change
- Deployment timeline
- Data and infrastructure provisioning costs
- Data-driven insights bring in a competitive advantage
- Faster and effective decision-making
- Identification and creation of new product and service revenue
- Predictability and faster time to market
- Enhanced customer engagement and experiences
- Improved customer acquisition and retention
- Real-time responses to events as they occur
Success Stories
Analytics-driven business transformation: Success stories
1. Data management solution for an event discovery platform
Fingent developed a data management solution for Plananza, an event discovery platform that connects people to the events that interest them. The application supports visualization of event locations, participation, performer lists, and real-time management of events, including attendees, performers, and economies of events.
- Automated data operations to simplify event management tasks, including registration, ticket generation, secure payment, and others
- Easy to manage large volumes of data, including events and participations
- Integrated social media sharing, email marketing, and promo codes
- Simplified event registration process for participants
2. Data visualization solution to analyze hospital performance
Fingent deployed a data visualization solution for the performance analysis of hospitals in England. The solution comprehends data from the NHS network to gauge hospital performance, including key metrics. It provides users with interactive, visual graphs linked across multiple disciplines, and detailed analysis of performance measured against key parameters.
- Shows financial, clinical, and geographical information
- Highlights key performance issues and indicators
- Customizable dashboards for individual requirements
- Real-time access to vital health information
3. Customized data analytics solution for a retail company
Premium Retail Services collaborated with Fingent to develop a customized data analytics solution that helps convert large volumes of data into user-friendly visual representations. Besides automating data input procedures, the solution helps in managing field data and assessing performance reviews.
- Valuable insights to optimize business processes
- Painless and reliable data management
- Viable and effective business model
- Intuitive data visualization
4. Custom analytics solution for data touchpoint analysis
Fingent developed a data analytics application for Quantlogic, a financial research firm, to improve their trading strategies. The solution allows Quantlogic to perform a predictive analysis of its financial data to support investment planning.
- 200,000+ data touchpoints analyzed against 12 verticals
- Improved predictive algorithm with high quality data and AI
- Radical data correlation and data archival processes
- Increased the probability of successful predictions
Unsure About How To Get Started?
Insights
More Insights on Data Analytics and Visualization
How to Use Data Analytics to Improve Enterprise Sales Numbers
From snake oil peddlers to the thirty-minute infomercial, we’ve seen it all when it comes to sales techniques. One thing is certain, though. Today’s consumers will not respond to “old school” sales practices. No longer will a “one-size-fits-all” sales approach work.


 US
US Insurance