Planning Safe Excavations with Data Analytics and Visualization

Challenges

Challenges:

Manual process of ticket updations, ineffective tracking, reporting, and budget planning

Industry

Industry

Utilities

solutions

Solutions:

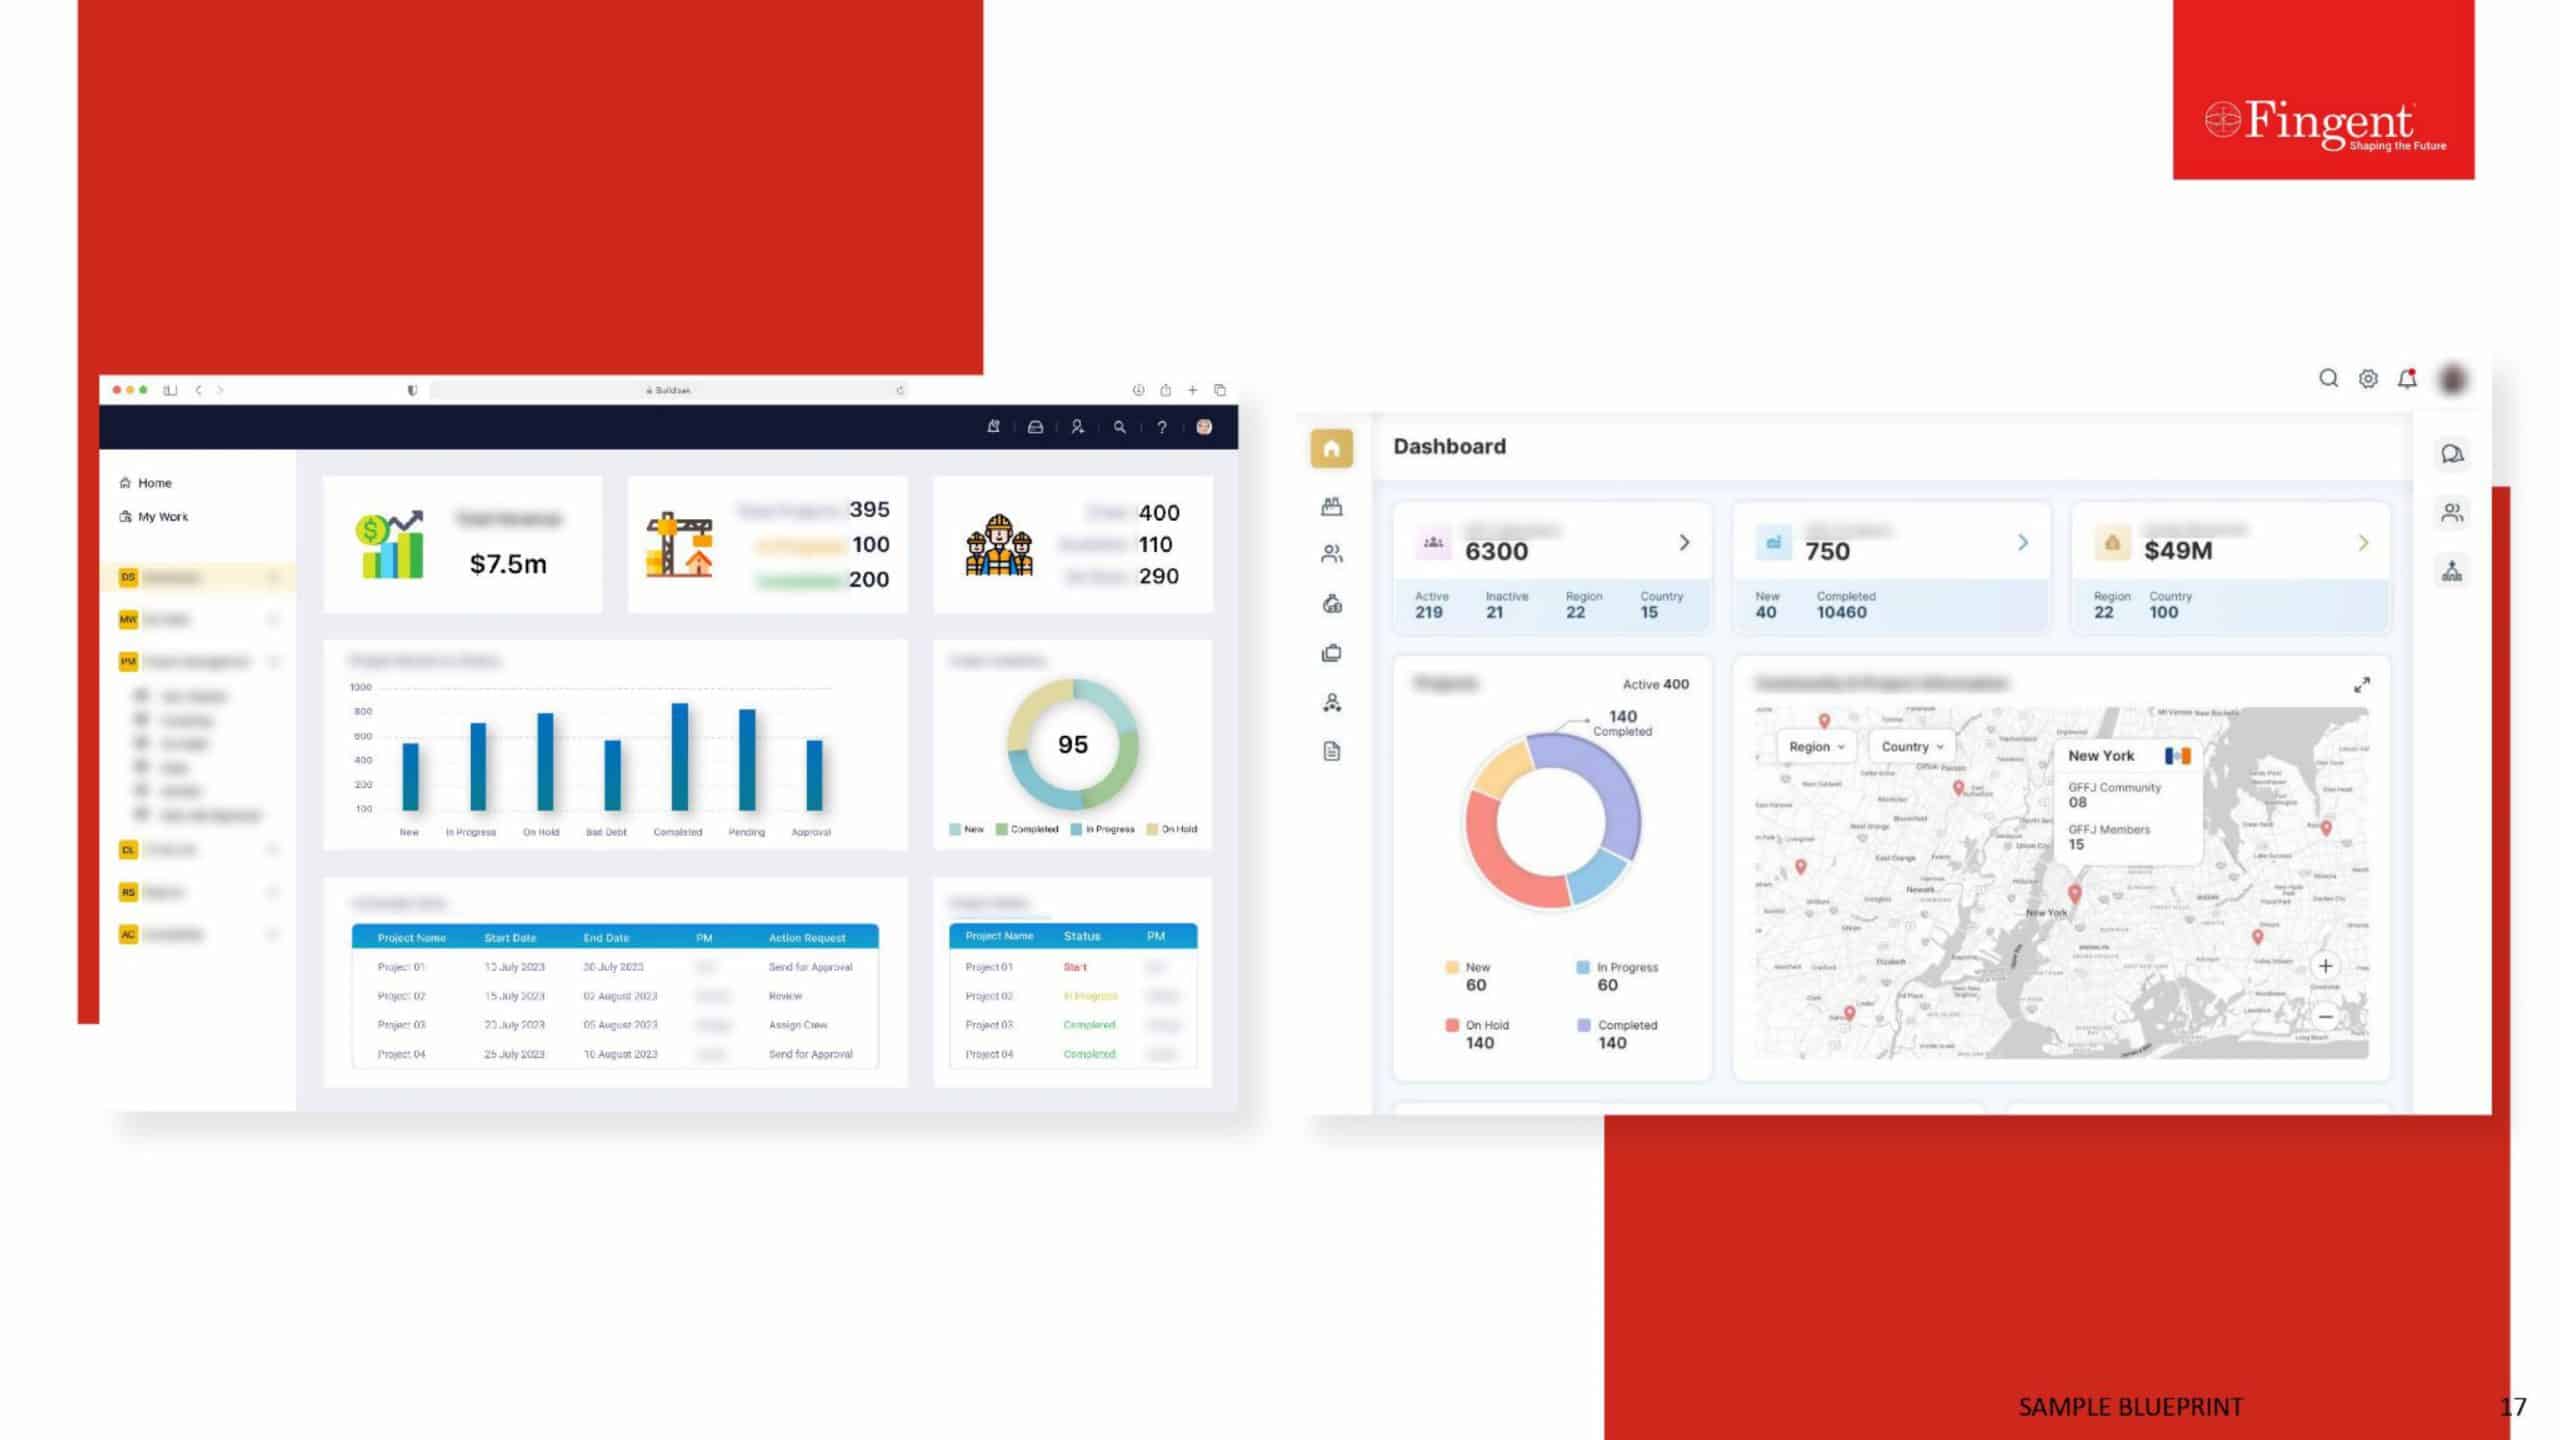
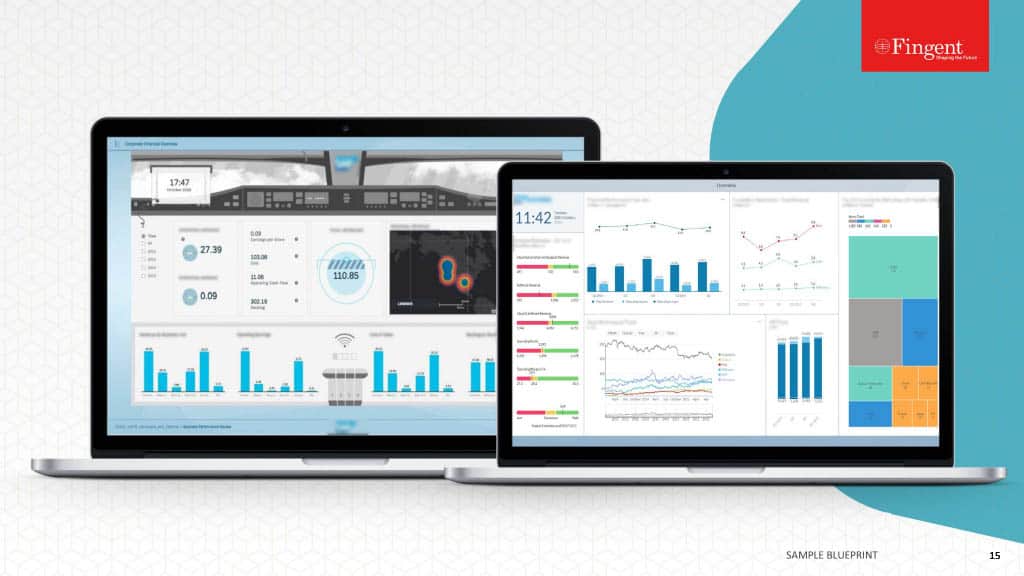
Using Tableau and Grafana to create an intuitive dashboard for a quick overview of useful metrics

results

Results:

Identify critical tickets quickly, easy assessment of financial expenditure, simplified tracking and reporting

location

Location:

US

About the Client

In the US, "Call Before You Dig Centers" are essential intermediaries, enabling citizens to identify and mark underground utility lines before excavation. Our client company enhances this process by offering a web and mobile portal where users can register and enter locate notices for these underground utilities.

Managing extensive and sensitive data proved challenging and time-consuming for the client. To address these issues, they partnered with Fingent, seeking advanced data visualization solutions to streamline operations and enhance decision-making.

Case Overview

Our client provides a web and mobile portal for registering locate notices for underground utilities, which are verified and forwarded to facility operators. Managing extensive data, follow-up actions, and updating ticket statuses presented significant complexities.

Fingent implemented intuitive dashboards using Tableau and Grafana for advanced data visualization. These dashboards offer quick access to crucial metrics, empowering client staff, users, and excavators with actionable insights. This enhancement improved efficiency and fostered better collaboration among all stakeholders.

CHALLENGES

Roadblocks Faced in the Existing System

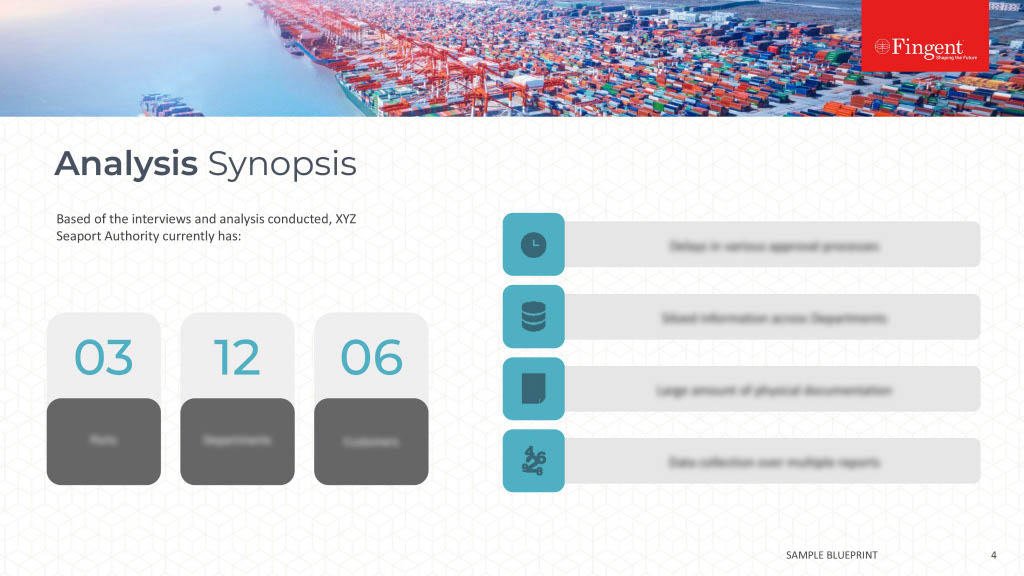
Managing vast amounts of data became increasingly burdensome.

Extracting meaningful insights from large volumes of data proved challenging.

Lack of quick access to essential information, which hampered decision-making.

Ineffective processes

Ineffective processes led to delays in ticket approvals.

Tracking financial expenditures

Tracking financial expenditures related to operations was challenging and inefficient.

SOLUTION

Fingent's Solution: Data Analytics and Visualization Dashboards

Fingent created multiple intuitive dashboards using Tableau and Graffana that gave a quick view of useful metrics for client staff, users, and excavators to be more productive, on track, and efficient with easy collaboration.

Overview of the member's live ticket and historic ticket statuses

Overview of the organization’s total budget, total spend, remaining budget, and budget spend percentage

Overview of the different operators, operating services, and operator types involved.

Insights that help the client to plan budgets better, track and identify tickets effectively, and generate reports faster.

Want to explore our client's full story?

SOLUTION BENEFITS

Making an Impact on Client Success

Fingent empowered the client by leveraging advanced data analytics and visualization tools to transform their operational efficiency in managing locate notices for underground utilities. Through the strategic implementation of map-based visualizations, financial expenditure assessments, and real-time data utilization, Fingent enabled the client to make informed decisions swiftly.

Map-based visualization of ticket patterns in the entire state of South Carolina

Financial expenditure assessment from budget vs spent data

Effective utilization of data to make timely and accurate decisions

Quick identification of critical and urgent tickets to avoid delays and major damages

Quick identification of top geographies with pending excavation requests

Intuitive Dashboards

Financial Expenditure
Assessment

Timely Decision-making

Critical Ticket Identification

Have a similar challenge or an idea to discuss?

Download Case Study


    Subscribe to Fingent's emails and newsletters

    ×